

Have you heard already? The future of the last-mile delivery is micromobility.
Since the pandemic began, fast delivery services have become essential to our daily lives. And with growing urbanisation, city deliveries are expected to grow 78% by 2030. Contributing to a 30% increase in greenhouse gas emissions in our cities. If we don’t do anything about it.
Luckily, alternatives are already available. Cargo bikes, scooters, drones and even robots all operate on electricity and present an opportunity to cut congestion and CO2 emissions big time. But how much exactly?
To demonstrate the benefits of micromobility, we chose an e-cargo bike, an electric car and a petrol car to compare the lifetime CO2 emissions over 200 000 km.
Comparing CO2 emissions: cars vs cargo bikes
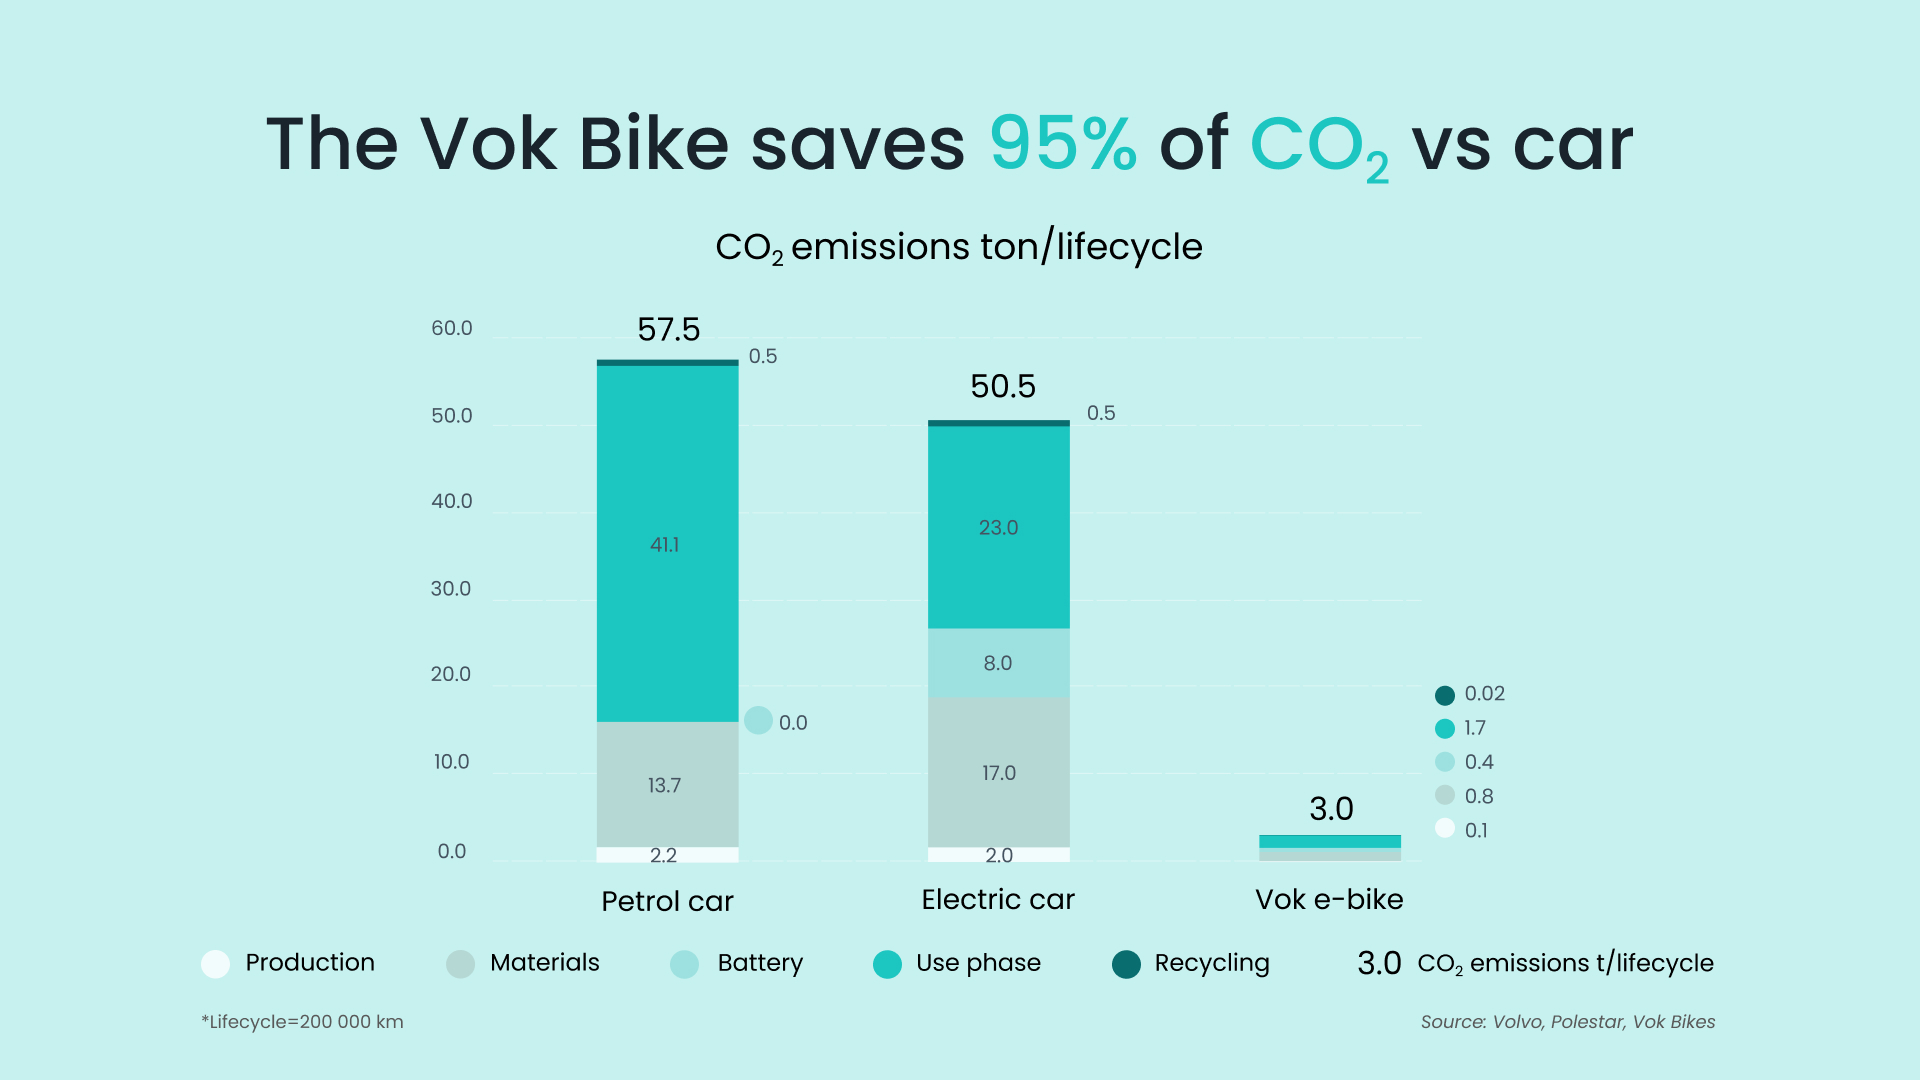
The graph above shows CO2 from the production, materials, battery, use phase and recycling. For all vehicles, the most significant contributor to CO2 is the use phase – whether it is the petrol or electricity that makes it move. The lifetime CO2 emissions amounted to 57.5 tons for a petrol-powered car, 50.5 tons for an electric car and 3 tons for an electric cargo bike.
Biggest contributors to cutting emissions
Probably the biggest surprise is that the savings from an electric car are not that significant compared to a petrol car. While in the use phase, the electric car emits about half of the CO2 that a petrol car would, the major CO2 contributors there are the production, materials and battery. Resulting in 7 tons of CO2 savings over a lifecycle of 200 000 km compared to a combustion-engined car. Of course, the longer the car is used, the bigger the difference in savings becomes.
Another clear conclusion is that the vehicle’s size is the most substantial contributor to CO2. While cars on average weigh about 2 tons, the cargo bike is 14x less – only 150 kg. The weight difference contributes to less energy consumption in the production and use phase – because there is 14 times less mass to build and carry around. Thus, the vehicle uses less energy; the wear on tyres and brake pads is lower, resulting in fewer emissions.
95% less CO2 emissions per lifecycle
We also need to clarify – electric cargo bikes are not carbon neutral. They create emissions in the production phase, and use phase – electricity, the wear on brakes and tyres contribute to emissions. However, the difference in emissions is mindblowing. Compared to a petrol-powered car, the e-cargo bike emits 94.8% (i.e. 54.5 tons) less CO2; and compared to an electric car, the savings are 94% (i.e. 47.5 tons) over a lifecycle.
Cutting emissions – which vehicle to choose?
When it comes to cutting congestion and CO2, cargo bikes and other micromobility vehicles are the clear winning choice over cars. Research shows cargo bikes have the potential to replace 32% of delivery, 50% of service trips and up to 80% of private car trips in urban areas. The EU sees cycling as a viable option to cut traffic jams and make cities more livable and thus has committed to promoting cycling through policy, infrastructure and subsidies.
Moreover, calculations show that 53% of delivery costs are associated with the last mile; thus, cutting last mile costs presents a significant opportunity for savings for operators. John Pearson, CEO at DHL Express Europe, said: “Bicycles offer a number of advantages in express delivery operations: they can bypass traffic congestion and make up to two times as many stops per hour than a delivery vehicle. The total cost of ownership over their lifetime is less than half of a van.” Take a closer look at the cost calculations comparing a petrol car and an e-cargo bike for more reasons to make the switch.